

Tim Dick, CFP®
Posted on Oct 1, 2026
If you have a 401(k), there’s a good chance a target date fund is doing most of the work in it, whether you chose it or not. Here’s what that fund actually is, and why two built for the same year can look nothing alike.
What Is a Target Date Fund?
A target date fund is a single mutual fund built around the year you’re assumed to retire. It holds a mix of stocks and bonds typically suited to someone with that retirement date, then shifts that mix automatically over time, growing more conservative as the target date nears. Since 2006, federal rules have allowed employers to use these funds as the default option for employees who are automatically enrolled in a retirement plan but never choose their own investments. As a result, a target date fund is probably the most common holding in employer retirement accounts today.
For most investors, that default option is a reasonable one. A target date fund offers instant diversification, professional management, and automatic rebalancing in a single investment, without requiring you to know the difference between a large-cap fund and an emerging markets bond fund, or to remember to shift your own allocation as you age.
But “target date fund” describes a fund’s strategy, not a single investment product. There are many different mutual fund issuers who offer target date funds, and their managers can build their strategies in very different ways. Two funds with the same target year can hold different allocations, take on different levels of risk, and charge different fees for a similar approach. To see how much that can vary in practice, we compared two popular 2030 funds:
- Fidelity Freedom 2030 K (FSNQX)
- American Funds 2030 Target Date R6 (RFETX)
Figures below reflect fund data as of September 30, 2026 (Performance and risk) and July 31, 2026 (portfolio composition), sourced via YCharts.
1. Performance Disparities
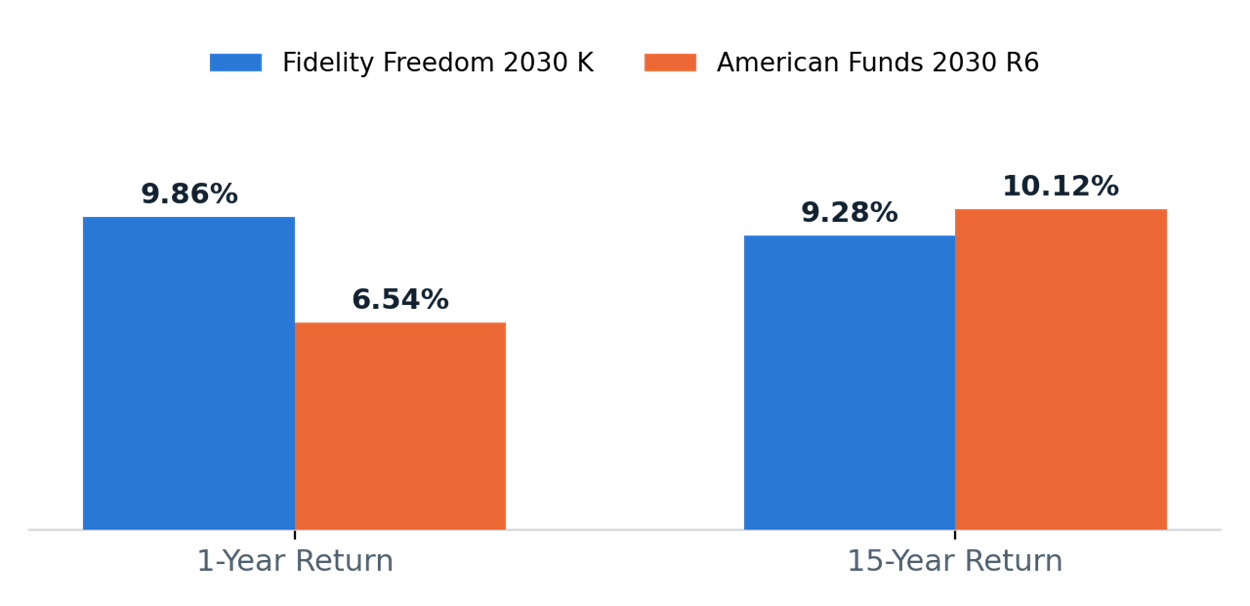
Over the past year, Fidelity has outpaced American Funds by a wide margin. Stretch the window to fifteen years and American Funds comes out ahead, 10.12% annualized versus 9.28%.
2. A 67% Gap in What You Pay
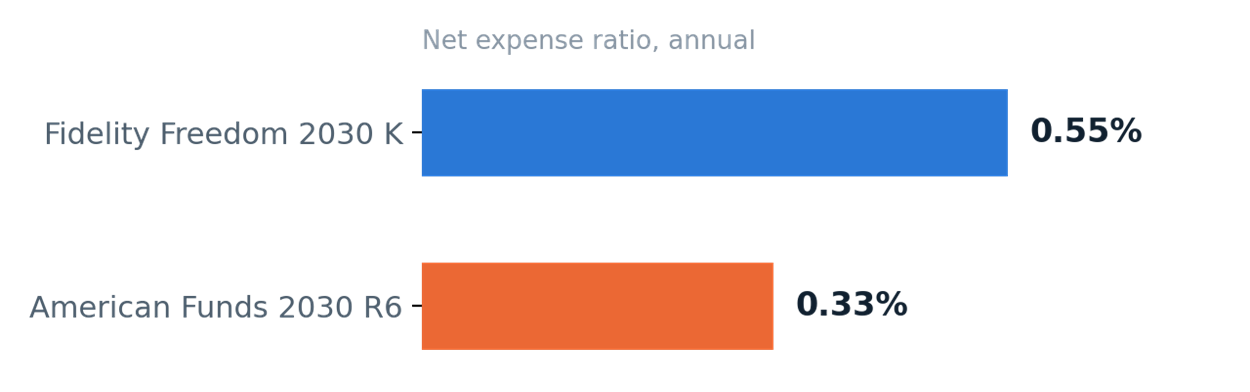
Fidelity charges 0.55% a year; American Funds charges 0.33%. On a $100,000 balance, that’s roughly $220 more every year, a gap that compounds meaningfully over a multi-decade holding period.
3. A Different Mix of Stocks, Bonds, and Cash
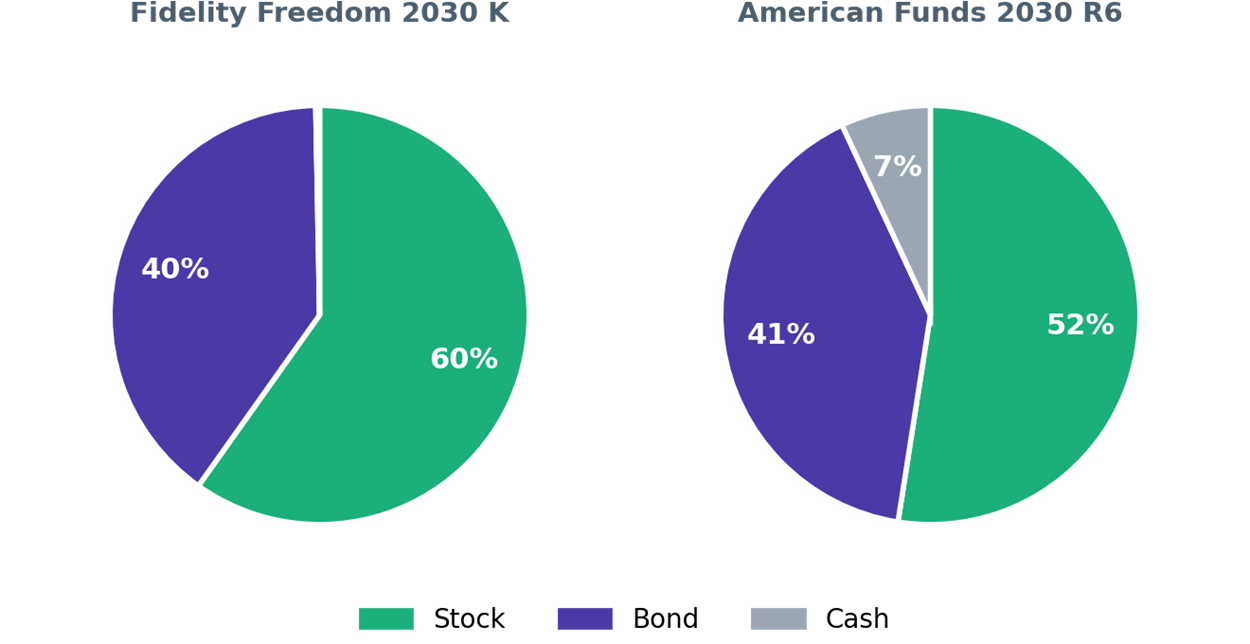
Fidelity runs slightly more in stocks with almost no cash buffer, fully invested. American Funds holds a bit less in stocks and keeps roughly 7% in cash, a modestly more conservative stance for the same target year.
4. Volatility
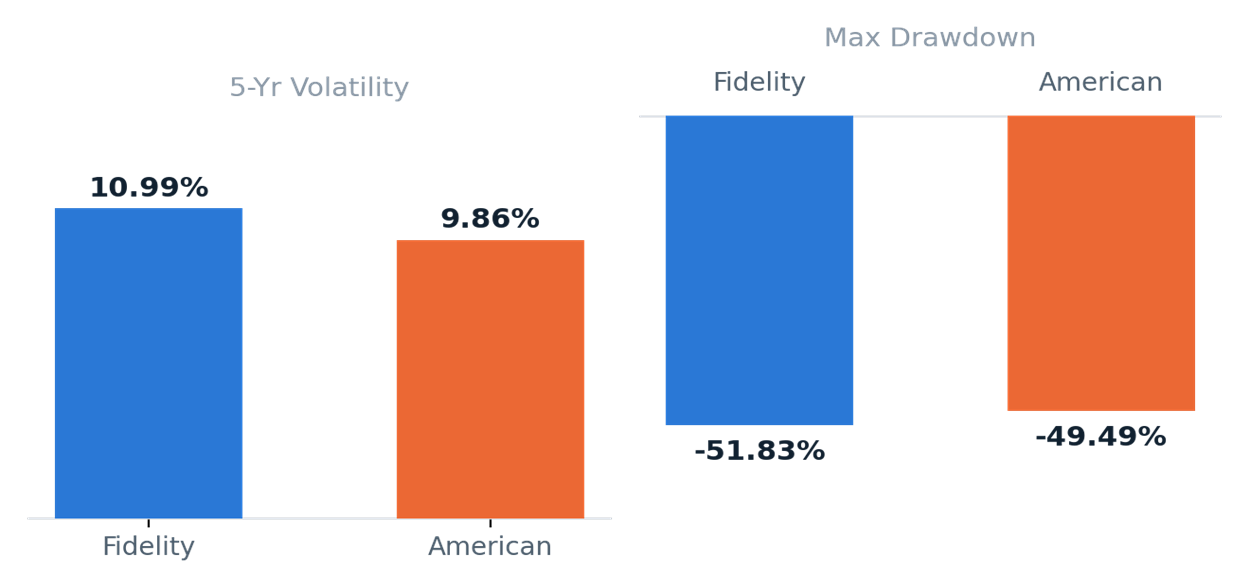
Fidelity’s version has run both hotter and colder than American Funds’: higher five-year volatility and a deeper historical decline, the tradeoff behind its stronger recent returns.
5. US vs. International
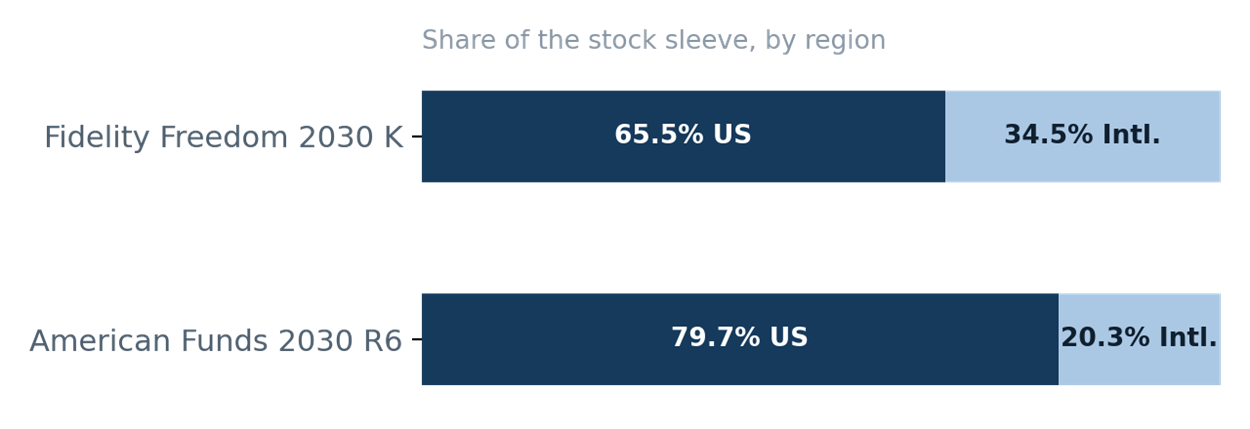
About 35% of Fidelity’s stock sleeve is invested outside the US, compared to 20% for American Funds. Fidelity leans further into international and emerging markets; American Funds stays closer to home.
Why the Default Isn’t Always the Right Fit
A target date fund only assumes one thing about you: the year you plan to retire. Take someone in their early sixties whose employer didn’t offer a 401(k) until a few years ago. They’re sitting in the same fund as a colleague who has contributed for thirty years, but their balance is a fraction of the size. Both funds here are already roughly 40% bonds, a glide path built for someone stepping back from risk as retirement nears, and for the person who started late, that mix can work against them: a smaller balance generally needs more growth, not less, and if they plan to keep working past 2030 out of necessity, their real time horizon is longer than the fund assumes.
Risk tolerance tells a different story. Someone who has saved steadily for decades and built a comfortable cushion, but who is naturally cautious, may find a fund like Fidelity’s uncomfortable to hold given its higher volatility and deeper historical decline. For that person, the extra potential return isn’t worth the added swings, even if they technically have the capacity to absorb them.
Spending plans add a third wrinkle. A retiree expecting to live simply on a fixed budget needs a different glide path than one planning to travel, support family, or carry a larger discretionary budget well into retirement. A higher expected spending rate generally calls for more growth earlier on to sustain those withdrawals over a longer horizon. Three people retiring in the same year, defaulted into the same fund, can need three different answers to that question, and the fund itself has no way to know which one it’s holding.
Neither fund here is wrong, and neither is the one sitting in your own plan. Both are diversified, professionally managed options. The fund matched to your birth year is a starting assumption, not a verdict. A plan built around your actual balance, timeline, and goals, rather than the calendar, is what decides whether it’s the right fit.
Fund data as of September 30, 2026 (performance, risk) and July 31, 2026 (portfolio composition), sourced via YCharts. Past performance does not guarantee future results; the return and principal value of an investment will fluctuate. This comparison is for informational purposes and is not a recommendation to buy or sell any security.
The information provided in this presentation should not be considered a recommendation to purchase or sell any particular security. Merrimack Wealth Management reserves the right to modify its current investment strategies and techniques based on changing market dynamics or client needs. It should not be assumed that any of the securities transactions, holdings or sectors discussed were or will prove to be profitable, or that the investment recommendations or decisions we make in the future will be profitable. Investing involves the risk of loss of principal. There is no assurance that any securities, sectors or industries discussed herein will be included in all portfolios invested in the strategy. Clients have the ability to impose reasonable restrictions on the management of their account. You should contact Merrimack Wealth Management should your investment objective, time horizon or general financial situation change, or if you would like to have a meeting to discuss your account. Past performance is no guarantee of future results. Performance presented is based on a representative account, which was chosen because it most closely conforms to the investment strategy. Individual account performance will vary based upon the inception date of the account, restrictions on the account, and other factors, and may not equal the performance presented herein. The S&P 500 index is provided for comparative purposes. The S&P 500 index is unmanaged and it is comprised of primarily large capitalization stocks. Merrimack Wealth Management is a member firm of The Fiduciary Alliance, LLC. The Fiduciary Alliance’s business operations, services, and fees is available at the SEC’s investment adviser public information website www.adviserinfo.sec.gov or from The Fiduciary Alliance upon request.